Showing posts with label credit. Show all posts

Tuesday, September 28, 2010

Housing Affordability 1971-2009: Chart Roundup (UPDATED)

This post is part of the series Housing Affordability 1971-2009

I have updated some of the charts from the previous posts and put them in one post for easier access. For explanations on the data and commentary, please follow the links to the source posts. Click "read more" to see all updates.

From Interest Rates and Borrowing Capacity:

Wednesday, August 18, 2010

Shut-up, WSJ: "Bond Bubble" edition

There has been a lot of noise in the blogosphere about the "bond bubble" (1) (2) lately. For what it's worth, I don't think there is so much a bond bubble as there is a system awash in liquidity that has to go somewhere. Some money is chasing momentum, some is chasing income, some is chasing yield that has more stability than equities can provide. I do think rates are absurdly low, but that's what happens in deflationary environments. The JGB bubble has been a "no-brainer" short for 15 years, but that trade has been a consistent loser for just as long. In general, I think bonds have limited potential to enter "bubble" territory right now because their value has a natural cap (that they trend to as maturity approaches) and because bubbles--in my mind at least--require massive amounts of credit to finance the purchases of the asset in a bubble, and that demand for loans would, you know, be reflected in higher interest rates that would halt the appreciation of bonds.

Tuesday, August 10, 2010

How Hogs Get Slaughtered: Structured Notes

In case you don't know, I work for an Independent Broker-Dealer. Near me is one of our bond guys, he specializes mostly in brokering bonds and other fixed-income instruments and some flow trading. Throughout the workday we'll chat about this or that and every once in a while he sends me some issue to look at if he finds them interesting or attractive.

A couple of weeks ago, he told me about a new-issue, a 20-year Bank of America CD. It was a tax, free, FDIC insured, floating-rate structured note with a 9% coupon and call protection for a year. I jumped out of my desk and came to his Bloomberg to check the deal out. We are a pretty small firm, around $5B in assets, so I don't know why we were getting an allocation. After all, most of our brokers would be buying no more than a couple of hundred thousand, maybe $1MM at most, to split between their customers. Something had to be wrong, otherwise someone higher-up would have picked it up first. With 20Y Treasuries yielding less than 4%, I was genuinely puzzled. Then, I noticed the terms of the deal:

  • Callable after 1 year
  • Floating yield (30YCMS - 2YCMS - 0.875%) * 4
  • Cap: 9%, Floor 0%
Yiiiikes! Let's go over each one of these features and see what they mean

Friday, July 30, 2010

Mobility and Underwater Homes: A humble suggestion

Today, the Washing Post reported:
Labor mobility has nearly ground to a halt in the past two years, and policymakers are increasingly worried that the slowdown is not just a symptom of the nation's economic struggles but also a barrier to overcoming them.
...
The biggest factor seems to be the large number of unemployed homeowners who have little or no home equity. Between 2006 and 2009, the number of renters who moved out of state decreased by 13.6 percent, according to census statistics, while interstate migration among homeowners has plummeted by 25.5 percent.
It must be a slow news day because this is no news. The WaPo covered it in June 2008. Bill over at Calculated Risk added:
approximately 1 in 8 households (the same proportion as with negative equity) will probably not accept a job transfer now because of depressed home values - and that is about 200,000 fewer households per year that will probably not move for better job opportunities.
This was all later confirmed by the Census Bureau in December 2008 and even more supporting evidence showed up in Paul Krugman's blog yesterday (source: Atlanta Fed). But I'm not here to berate the WaPo on repeating themselves, we all do it, I'm here to put a couple of things together and make a suggestion.

The problem
People with low or negative equity are not moving to the areas where they could find a job because they are trapped by unrealized losses or don't want to realize these losses. I would be willing to venture the guess than in the past households used proceeds from capital gains or built-up equity to fund relocation expenses; with low/negative equity, that just isn't possible.

Credit to MacroBlog
Additional obstacles
Cutting people's principal is a non-starter in many cases. Banks don't want to get a reputation for cutting loan principals and non-delinquent homeowners see it as reckless buyers getting rewarded at their expense.

A proposed solution
Seeing as how the government is already throwing massive amounts of money away trying to either reflate, or turn people into permanent renters, I suggest something slightly different. The government could maybe create a facility that lends money to underwater homeowners that need to free themselves from a home.

This is not a giveaway, it is a loan. This is not a below-market-rate loan, and therefore carries no implicit subsidy. The loans should probably made at a rate similar to or slightly higher than the original mortgage rate. Home-owners who are underwater and are being held-back from taking a job in a different area should be offered the loans, which would be contingent on a job offer. The loans would be used to pay-off negative equity at the time of a home sale. The borrower could then free him or herself from the home anchoring him or her down and return to employment.

I don't know if this next part is possible, but if the lending facility vowed to reduce the rate on the loans by a set amount if the borrower transformed the loan into a second lien on any new property bought, it could furthermore enhance the quality of these loans. These loans could then either be kept until maturity or sold to banks for securitization for a profit. Why a profit? Well, if the transaction was correctly orchestrated, the borrower rid him or herself of the anchor home, allowing them to enter a new job. If the borrower decided to buy a new home, the drop in rates would almost ensure they will be able to buy a similar home for a smaller monthly payment, improving the debt-to-income ratio. Because of the same lower rates, the new monthly mortgage payment plus the loan payment should be lower than the original mortgage payment, putting the borrower in a better position to meet their obligations. Additionally, banks holding undercollateralized loans would get to rid themselves of those loans and the possible losses associated with future defaults or short-sales. Finally, freeing people from their underwater properties would increase liquidity in the real-estate market, encouraging price discovery, getting assets to the people that want them and getting people to the employers that want them. Here's the list of pros in my mind:
  • Worker mobility is augmented
  • Worker / employer mismatched is reduced, increasing employment and PCEs and income taxes collected
  • Putting people to work reduces unemployment benefits being paid out
  • People decrease their debt service expense, leaving more money for PCEs
  • Real-estate liquidity improves
  • A couple of commissions are generated for brokers
  • Price discovery is sped up
  • Undercollateralized loans are reduced
There may be no debt permanently retired, but increasing mobility and employment prospects should put the underwater borrowers in a better position to pay-off their loans. If they still default, well, they probably would have done so anyways, and seeing as how the Fannie & Freddie black-holes probably guaranteed that paper, the Treasury would have probably taken the same loss on the assets--more if you include the added expense of the foreclosure process. Before you argue that it's basically a subsidy for the MBS holders, think about who owns $2T in MBS and who guarantees a whole lot of the rest.

Housing Affordability 1971-2009: Chart Roundup

This post is part of the series Housing Affordability 1971-2009

I have collected all of the charts from the previous posts in the series and put them in one post for easier access. For explanations on the data and commentary, please follow the links to the source posts.

Tuesday, July 27, 2010

Housing Affordability 1971-2009: Payments, Prices and Capacity

This post is part of the series Housing Affordability 1971-2009

In the last post I talked about the growth in prices in percentage terms. Today's post includes the same data, but using a nominal scale. While I think the percent change charts are great for looking at long-term, the nominal charts do a better job of communicating the differences in dollars and cents.

Here we can see the relationship between the median-price for new homes and the purchasing power of a payment equal to 30% of the median-household income. Judging by the gap, my estimate of 30% is close, but not perfect. I discussed my reasons for using this figure in Two Ways of Looking at It.  Once I post the source spreadsheet you will be able to fill-in any values you want to see plotted for the %-of-income and down-payment variables. Please note these are not in log-scale because the actual figures became a harder to read. You can find the log-scale versions at the bottom of this post.

Monday, July 26, 2010

Housing Affordability 1971-2009: Long-Term Trends

This post is part of the series Housing Affordability 1971-2009

In the last post I discussed the comparison I used for this analysis and why I chose certain data series over others. In this post we will look at long-term trends in income and prices and how lower interest rates have allowed prices to rise faster than income. Rents and the CPI less shelter figure are also included to illustrate the divergence of the trend home prices from the trend in consumer goods.

I am excluding shelter from the CPI figure because I want to display how the trend in housing differed from everything else and comparing housing prices to an unadjusted CPI would understate the growth in prices.

For rents, I decided to use the "rent of primary residence" series in the CPI. The BLS does not publish rents in their average price survey, and the only nominal figure I found came from the HUD, and after looking at collection methods, I was not impressed with the quality or coverage of the survey. Since the Census Bureau does not offer a national figure, I am still looking for better rents data1.

Sunday, July 25, 2010

Housing Affordability 1971-2009: Two Ways of Looking at It

This post is part of the series Housing Affordability 1971-2009

In the previous post, I discussed how borrowing capacity changes with respect to interest rates, finishing up with an example of the buying power of a $500 monthly mortgage payment from 1971-2009.  The example is obviously a gross oversimplification; income and price levels can and have changed since then.  To try to make some sense of this all, I decided to look at the data from two sides:
  • The change over time in the cost of a median-price new home and the monthly mortgage payment necessary to buy it, a function of the price level and interest rate. 
  • The change over time in the median-household income and the borrowing capacity based on it, a function of the income level and interest rate.
I chose to define borrowing capacity by calculating the amortized loan principal that would require a payment equal to 30% of a median-income household's earnings.

Friday, July 23, 2010

Housing Affordability 1971-2009: Interest Rates and Borrowing Capacity

This post is part of the series Housing Affordability 1971-2009

We'll begin the series by talking about interest rates and borrowing capacity. If you are already familiar with the subject, this may not be of interest to you as the discussion will be a bit basic. There will be more interesting things in the future, I promise.

For purchases that are as large and have as little equity as most home purchases, the effect of interest rates is very large. For example, a $100 monthly payment at the current rates of 4.4% could buy a $22,188 home assuming a 10% down-payment. The same monthly payment at 18.45%, last seen in October 1981, could only buy a $7,197 home assuming the same 10% down-payment; that's about a third of the purchasing capacity. While I picked the most extreme points in the data-set, the example serves its purpose. For this same reason, it is useless to talk about home prices without also talking about interest rates, as affordability is measured in the monthly payment, not total cost, for most people. With mortgage rates at historic lows, the buying capacity of a monthly payment is the most it has ever been. Furthermore, if deflationary pressures and extremely loose monetary policy don't cease, we could see that capacity increase even more, since purchasing capacity increases at an increasing rate as interest rates drop, as you can see below (click for larger image).

Tuesday, May 11, 2010

Chinese money-supply growth slows, reserves inch lower

To see the latest data please see the label Chinese Money Supply
 
Hot on the heels of my complaint about the People's Bank of China not publishing money-supply statistics, the numbers have been published to their Chinese-language website, although still no 2010 data in the English-language version. It's becoming clear that there is evidence of overheating, although--as the second graph suggests--the government's efforts in slowing down growth have worked. In particular, the changes seen between Q1-2009 and Q2-2009 are indicative of overheating. Particularly notable, the M1 changes seen in the last 3 quarters signal the credit-expansion I was referring to last time I wrote about China.

The fact that M1 is still growing at an accelerating pace is worrysome. Just today, Bloomberg reported increasing inflation, hot on the heels of monetary tightening over the past couple of months. While this might sound counter-intuitive, it is well-covered by "Charles" on M Pettis' website. Part of his point being that when people are working towards a target sum by a certain date, lowering the discount rate will only serve to increase the savings rate as people have to make up lost interest income, or that when people have most of their savings in bank deposits instead of other assets, a decrease in the discount rate will have a negative wealth effect. That neat little digression aside, the point I am trying to make here is that these cultural differences in saving and spending behavior coupled with fears about declining purchasing-power of money could lead to an increasing demand for hard-assets, leading to additional upward pressure on prices.

For now, though,  I still think the Chinese "real-estate bubble" is a little too hyped up. Their banking rules require lower LTVs and their bank reserve-requirements are higher, making a US-style housing implosion unlikely. Asset prices may drop or stagnate, but I doubt a full-on implosion leading to a banking crisis is possible without the fuel provided by zero-downs, neg-ams etc. What I would love to see is some data as to what % of bank assets real-estate backed loans compromise and their average LTV. If one is to find evidence of a bubble or lack there-of, it'd be there.

Thursday, April 22, 2010

All debts must be paid, even Greek ones

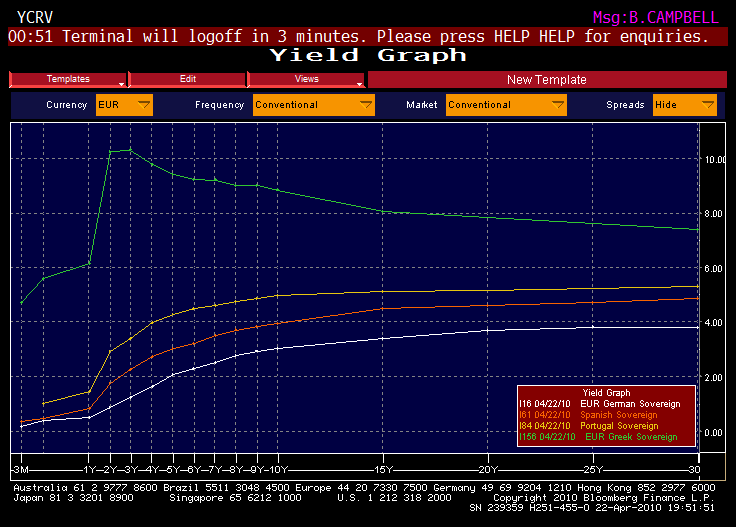
So, I'd like to publicly admit here that I was oh-so-wrong about Greece. It looks like they really won't be able to make it through May without a bailout. I really didn't expect this to happen until 2011 or 2012 but, with 10yr rates at over 800bp, fresh downgrades and rumors of restructuring, it doesn't look so good. While many are going to go on about the moral hazard in the bailout and why they should be kicked out of the Euro, I want to focus on something else.

Why would other Euro countries agree to a bailout?
Let's start with what I think is the biggest part, which I will explain with the this quote,
"When you owe someone $1,000 and you can't pay, you have a problem. When you owe someone $100,000,000 and you can't pay, they have a problem."
Banks across Europe hold Greek bonds. The fact that they could be repoed at the ECB for liquidity and they had a higher yield made them attractive. If Greek creditors push Greece too hard, they might just take their proverbial ball and go home. They really could just give up on the Euro and tell their creditors: I'm not paying you. If that happens, a lot of European banks are likely to face substantial losses. I can't tell you how much because there is no reliable source for this data, even what you see in Die Spiegel seems a little iffy. If what we saw during the Panic of '08 is any indication, banks taking the Greek losses would simply end up bailed out by their respective governments anyways. The liabilities won't vanish, they'll just move to a larger balance sheet until they reach the biggest one (governments), at which point they are socialized. It's just the way it works at this present point in time, so deal with it.

Back to defaults: A ruthless external default would do no good for anyone. A disorderly financial meltdown would risk contagion across the rest of the heavily indebted EU nations and emerging markets. Rising spreads could put enough pressure on the likes of Spain, Italy or Portugal that they too decide they can't/don't want to play the EUR game anymore, which brings us back to the whole bank liabilities thing. Someone, somewhere owns all this debt and someone, somewhere is going to have to take a loss if we let this all get out of hand and, if that loss is big enough, then we'll all have to share this loss through inflation, recession, higher taxes, service cuts etc. There is no way around it, the debt must be paid in some form or another by someone. Stoking a disorderly collapse will just ensure we'll be the only ones cleaning up the ensuing mess.

I love recession pr0n just as much as the next blogger (we are a bearish bunch) but these are real lives we are talking about. I am in no means fan of a bailout, but it might be the least-costly way to resolve this. Italy, Ireland, Spain and the UK are all on shaky ground as far as debts go, they don't need their spreads shooting up. A disorderly collapse that leads to bank bailouts, another recessionary dip and more fiscal stimulus sounds really expensive,  politically, socially and financially. Greece might be able to get out of this predicament, or not, but we won't know unless they get a chance. Yes, the proposed rescue package is essentially just kicking the can down the road, but time has a funny way of healing some wounds.

I can't believe you are defending that profligate bunch! Why couldn't be more like industrious Germany with that awesome trade surplus?!
Whatever, seriously. You can't run a surplus without someone running a deficit, it's just the way it works. Savers need borrowers and vice-versa. Not only that, but Greece paid a risk-premium. A risk-premium is extra yield you pay because there is--wait for it--risk! A risk-premium is what you pay for the right to fail. By asking for a risk premium the market is saying, "We'll lend you this money, but at higher rates because we are not sure you'll be able to pay us back." Creditors can demand their money all they want, but you can't take back something that isn't there anymore. They aren't going to get it, so they might as well try to be civil and try to figure out a plan to recoup whatever they can because at this point the debtor holds a lot of cards.

To end, here's some graphs for your viewing pleasure (GREECE SHORT is short T-bills, the rest is bonds):

Saturday, March 20, 2010

PIIGS Debt Coming Due: Is it really an issue?

Der Spiegel published the following graph as part as the ongoing Portugal / Greece / Italy / Ireland / Spain crisis porn.


Let's not all just freak out just yet. Let's do our homework:

As of this writing the PIIGS are borrowing ta the following rates (Economist 3/20 -3/26):
  • Portugal: ??
  • Ireland: ??
  • Italy: 3m @ 64bp and 10y @ 390bp
  • Greece: 3m @64bp and 10y @594bp
  • Spain: 3m @ 66bp and 10y @ 384bp
The economist also tells us that the average maturity of this debt stands as follows

  • Portugal: 6.5 years
  • Ireland: 6.8 years
  • Italy: 7.2 years
  • Greece: 7.7 years
  • Spain: 6.7 years
Now, what I'd like to know is when this debt coming due was issued and at what cost to the government. If the yield at issue was higher than their current borrowing rates, well, that's not really a problem. Second, who owns all this debt? The local banks? foreign banks? regular people? If it's mostly local banks that hold this debt, i don't imagine the refinancing is going to be much of an issue, after all, the banks have to do something with that cash. Could rates move up as the supply of debt overwhelms the demand? Yes. Do I think this is as big of a deal as it is being painted to be? Hell no.