With mortgage rates near record lows, due both to low inflation and negative real rates, the leveraged purchasing power of real wages is near historic maximums. Additionally, for the most part, it looks like the bottom is in for housing price declines. Does this make it a good time to buy leveraged real-estate to capture future price appreciation while financing it at low rates? I do not think it's as clear as many people think it is. Below we'll explore why.
 |
Purchasing power of a $1,000 monthly payment on a
30-year fixed-rate mortgage assuming 15% down-payment. |
The purchasing power of a fixed monthly payment is dependent on two things, the number of periods, and the interest rate. If we maintain the the number of payments constant and put interest rates on the
x axis and purchasing power on the
y axis, you can see how purchasing power declines at a declining rate as rates increasing. In other words, it is an inverse exponential function, the first derivative of purchasing power with respect to rates is negative while the second derivative is positive.
 |
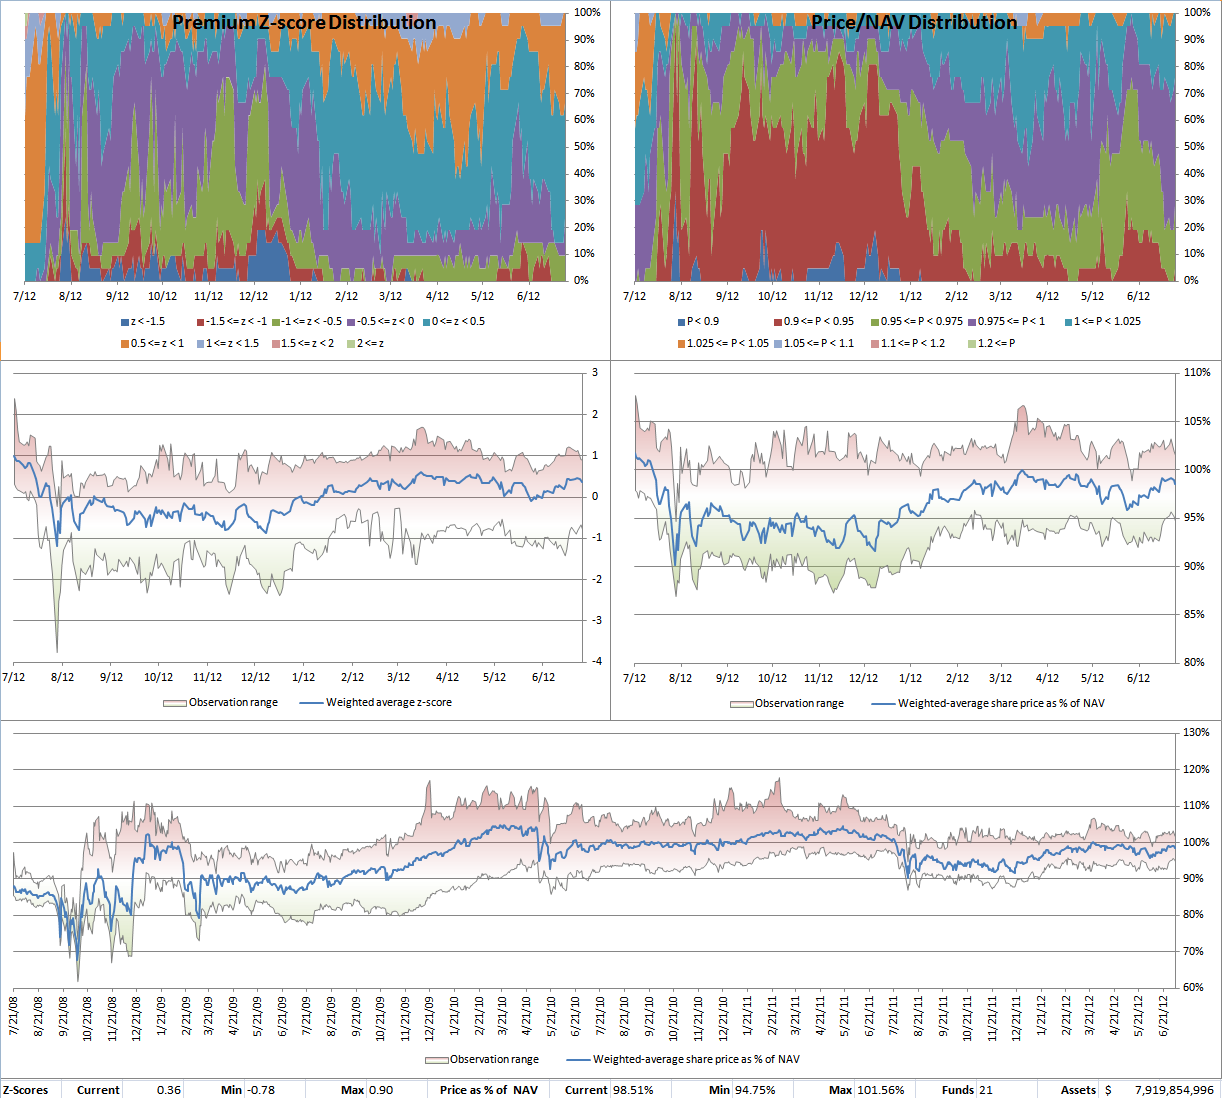
| "primary-secondary" spread |
To keep this exercise simple, we will consider the interest rate on a mortgage to be a function of a risk-free rate and a spread. For the sake of simplicity we will consider this spread as compensation the lender receives for taking-on various risks and duties (credit and prepayment risks as well as compensate the the servicer of the loan). The two accompanying screenshots illustrate the "primary-secondary" spread, or the spread between mortgage rates and the yield on mortgage-backed securities, and the spread between the yield of a 30-year current coupon MBS and the 10-year US Treasury Note. The sum of these two spreads roughly represents the aggregate spread between risk-free rates and the national average average mortgage rate.
 |
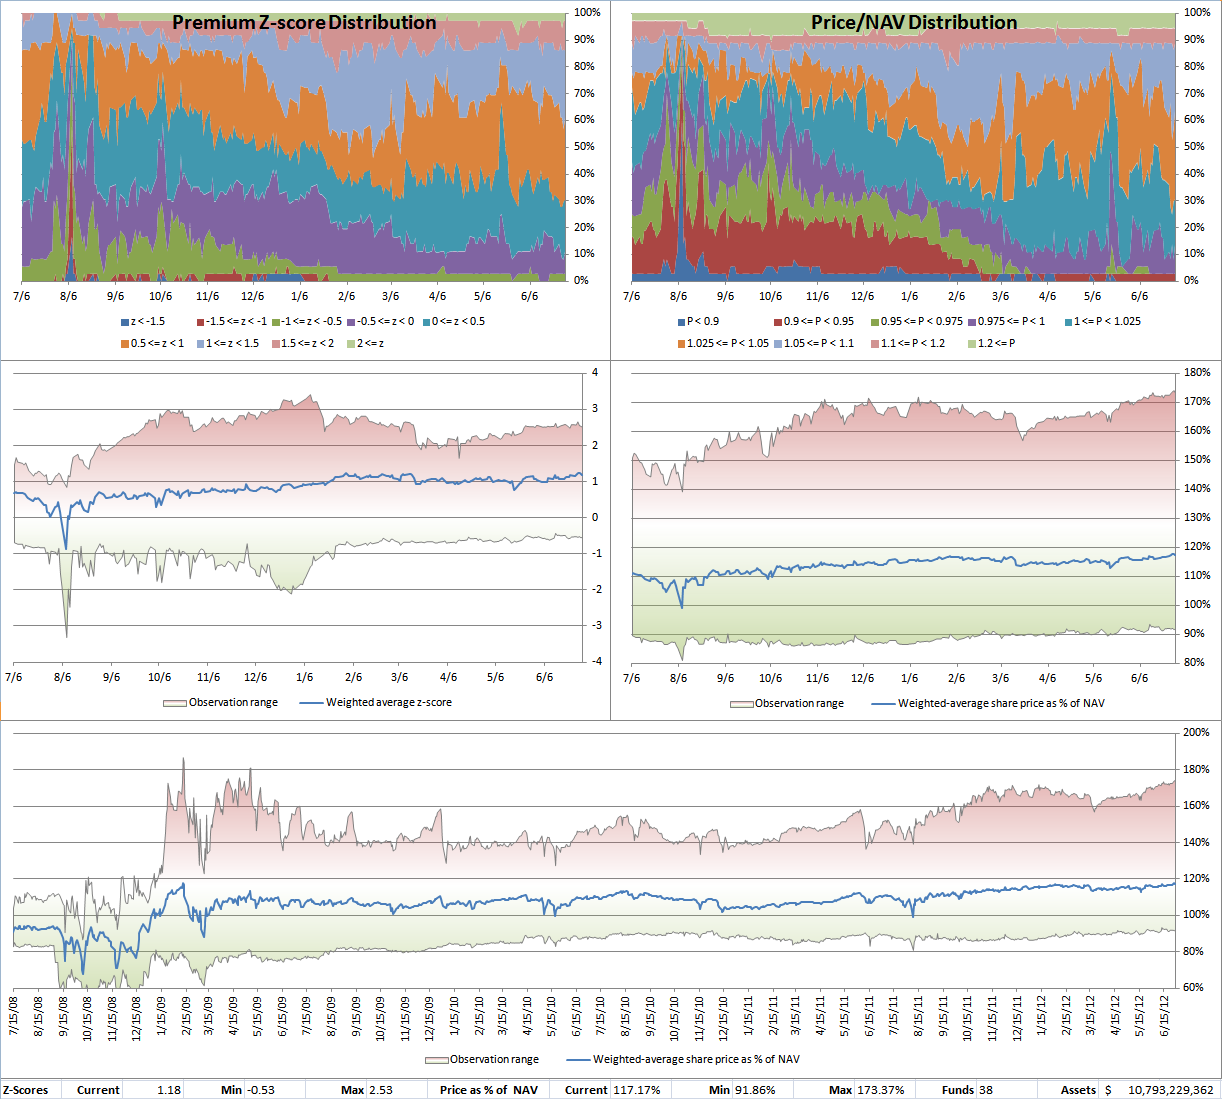
| Fannie Mae current coupon, 10-year US Treasury Note spread |
As
previously discussed, this is one of the main channels in which the Fed has been supporting the property market. By lowering the Fed funds target and through LSAPs (Large Scale Asset Purchases, colloquially known as QE or Quantitative Easing) they increased the purchasing power of payments by lowering the spread of MBS trade at to treasuries and lowered interest rates. Later on, by buying US Treasury notes and bonds, in what is sometimes called QE2, they lowered interest rates. And, finally, with 2011s "Operation Twist," they helped flatten the yield curve and bring down longer-term interest rates. By buying Treasuries and Agency MBS, the Fed pushed underlying risk-free rates down and and helped put downward pressure on the spread by pushing down the value of the embedded option in the securities (lowering implied volatility of the embedded option).

Finally, we need to recognize that the risk-free rate is also a function of two factors, the real rate of interest and future inflation expectations. The real rate of interest + inflation expectations equal the nominal rate of interest. We can observe the real rate of interest through Treasury Inflation Protected Securities (TIPS) and can compute inflation expectations by comparing that to the yield on regular treasuries, this is called the break-even rate. Therefore we now see that the purchasing power of a monthly payment is dependent on the mortgage spread, the level of real rates, and the market's expectation of future inflation.
You're probably thinking, "
gee, thanks for the lesson, but what does this have to do with home prices?" Well, everything. As you can see from the charts above, both the spread on MBS and the level of real rates (how much return lenders expect to earn after inflation) are both at historical lows and the primary-secondary spread is refusing to fall despite record-tight spreads to treasuries. Increases in either real rates or MBS spreads would, unless accompanied by falling inflation expectations or lower primary-secondary spread, cause a fall in purchasing power. In fact, an increase from present mortgage rates of just 0.50% would lower the purchasing power of a payment by almost 6%!
 |
Historical % of median household income required to buy
a median-price existing home at prevailing mortgage rates |
|
Until now we have worked through this exercise assuming the payment is fixed but, historically, we find that home prices tend to roughly follow wages. As you can see from the chart to the right, the payment required to buy a median price existing-home using the national average of mortgage rates mostly oscillates between 25% and 35% of median household income (mean is 30%). In other words, housing prices are constrained by purchasing, which is a function of wages and and interest rates. Which, finally, leads me to the reason I do not believe increases in home prices are as sure a bet as many think.
 |
| Purchasing power of various payments at a 3.5% interest rate |
For home prices to sustainably exceed inflation, wage gains have to outpace inflation by more than the increase in rates over that same time period. We saw in the first chart that purchasing power
increases at an increasing rate as rates decline. Here, we can see that see that, at a fixed interest rate, purchasing power increases
at a stable rate with payment. This means that for home prices to sustainably increase, growth in wages not only has to outpace inflation, but it has to outpace it by a margin wide enough to compensate for losses in purchasing power from any changes in the mortgage rate during that same period.
The Federal reserve is taking extraordinary actions to keep interest rates, risk-spreads and implied volatility low in order to stimulate the economy and achieve their 2% inflation-rate target. Remember Chairman Bernanke publicly stated,
"[the 2 percent target is] not a ceiling, it’s a symmetric objective." While this leaves the door open for future easing in the near-term, we need to remember that, at some point, the easing cycle will stop and drop in real rates will stop, even if it seems unthinkable now.
My good friend
David Schawel and I like to joke around that the Fed was nice enough to allow us to recognize all the future income of our bonds early. And, in a way, this is exactly what the Fed is trying to achieve with housing. By inflating purchasing power through lower real rates and compressed spreads, the Fed has allowed home-owners to recognize the future appreciation of their property at an accelerated pace. In the future, as real growth returns and, with it, real rates rise, the purchasing power of a payment will drop and rising home prices will require either households to devote a larger % of household income to housing and/or wages to increase at a rate faster than inflation. Remember, a 0.5% increase in mortgage rates from current levels would reduce purchasing power by about 5.94% if we maintained payment unchanged. At the same time, the increase in payment for a stable loan price if rates rose 0.50% would be 6.32%. In other words, to maintain prices stable, monthly outlays need to increase at a faster rate than pricing power decreases due to any change in rate moves.
Depressed real estate prices and low financing rates are leading many to see the current climate as a golden opportunity to buy leveraged real-estate, but price increases are not guaranteed, and the pay-out on a leveraged bet on housing is dependent many different factors. While affordability remains high and payments as % of income are near historic lows due to the Fed's extremely accommodating policy, an economic recovery can put an end to Fed accommodation and suspension of the Fed's MBS reinvestment program would be reflected on both, the risk-free interest rate and the spread at which MBS trade, turning a tailwind into a headwind for price appreciation. Leveraged buyers also run the risk of near-term price declines or inflation rates below the rate priced in by nominal rates. Leveraged real estate requires price appreciation and/or profits from rents to outpace the rate of inflation built-in to interest rates, which as we already saw, is
not near lows.
I don't have an opinion on whether residential real-estate is a good or bad investment, it's not my line of work, but I think many investors are failing to see that a leveraged bet on real-estate price appreciation is, indirectly, a bet on inflation exceeding current inflation expectations and future wages increasing at a rate faster than inflation.
Under an inflationary environment, increases in the real price level of real estate would require a mix of an increase in the % of income spent on housing and real wages in order to allow growth in outlays to outpace the loss in purchasing power created by any increase in real-rates, inflation expectations, or mortgage spreads.


