One of the arguments against equities that has been tirelessly repeated by managers like Hussman and Grantham has been that profit margins were too high and were due for mean reversion. Profit margins are indeed high, at approximately +2.8 standard deviations, or 10.6%, as a result of low interest rates (low cost of capital), depressed labor costs stemming from high unemployment and a near record low effective corporate tax rate (~18.6%).
 |
| Standardized Corporate Profits After Tax divided by GDP |
The main argument for profit margin mean-reversion is that high
margins invite new competition while low margins discourage new
entrants. Profit margins are also important to investors because steep reductions in profit margins tend to be coincident with steep
drops in corporate profits.
 |
| Standardized Corporate Profits After Tax divided by GDP and Corporate Taxes as a % of Prior Peak |
While the prior charts may be alarming to equity investors seeing record-high (+2.8 stdev on latest quarter, or approx 10.6%) profit margins, we should ask ourselves,
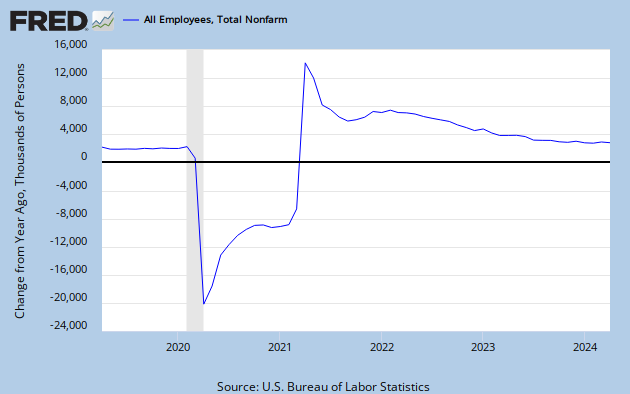
what will cause this mean reversion? The economy seems to be creating about
2 million jobs a year right now, not exactly enough to put heavy pressure on labor markets.
Fixed Investment continues to be pathetic (more
here).
The 10y yield has dropped 50 basis points since the beginning of the year and 1.5% from last year's median. What is left? Are underlying gross margins really that high? If so, why aren't new entrants taking advantage of cheap labor, low rates, and plentiful capital to undercut the competition and get a piece of those juicy, juicy margins?
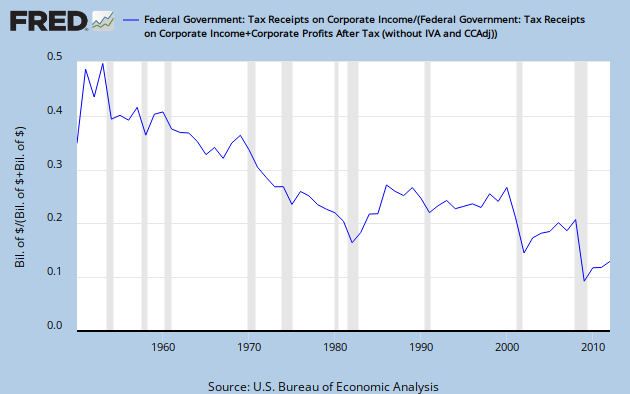
Could it actually be the that maybe underlying margins on goods and services are not THAT high? Below you'll see a now similar chart which includes pre-tax corporate profits. As you can see, while pre-tax margins are elevated, they are much less alarming at +1.33 standard deviations and the rest is the effect of a
near record low tax rate of 18.6%.
(
Note: above charts are quarterly and the one below is yearly since tax receipts are only available on a yearly basis.)
 | | |
| Standardized Corporate Profits as % of GDP Before and After Tax |
|
|
In conclusion, it appears that the only danger to corporate profits in the short term is a large, sudden increase in the effective tax rate or a sudden drop in final demand leading to a drop in sales and profits.
With interest rates still falling and a multi-year liability repricing cycle, there is little immediate danger from a bottom in rates. Additionally, a fixed investment and/or employment boom which drove the cost of labor upwards would mean increases in final demand and GDP, leading to shrinking margins coupled with growing top-lines, not exactly a disaster.
Unless you see a recession in our very near future, it seems there's simply nothing to see here.


