Much has been made of the record levels of corporate tax profits over the last two years. From
GMO's warnings of an 1100 "fair price" for S&P 500, to
Hussman's forecast of 10y of negative nominal returns, to the economics "It" girl of the moment, the
Kalecky-Levy profits equation.
Real median household income, in my opinion at a cyclical bottom, is back to early-to-mid 90s levels and as ZeroHedge (the best indicator of policy bear zeitgeist) reports,
wages are at an all-time low relative to profits. Meanwhile, it seems like the entire Very Serious Old Guy complex is warning of mean reversion in a laundry list of ratio measures, but nobody wants to talk about whether it will be the nominator or denominator that will change. It is my intention to illustrate exactly how these measures will mean revert in a simple, common-sense way accessible to anyone with a cursory understanding of supply and demand curves and lay out what I expect to be a way to make investments guided by this thesis.
Corporate profits are high because effective tax rates are low, real wages are low, and debt to large companies is cheap, a point I've
previously made. They are about to start shrinking. When? Like right now. Maybe last month, or last quarter, even. What led me to write about this is, believe it or not, is public sector employment. Employees of State, Local and Federal governments are not many,
they peaked at 14.68% of the labor force (not including the census high) exactly as private payrolls hit bottom, and hit a trough in June and July 2013 at 14.01% representing 21,826,000 employees. In other words, fiscal drag added 0.67% to the unemployment rate.
But this summer we had three important developments:
- The labor force stopped growing
- The number of public sector employees stopped shrinking and may be growing
- Real average hourly earnings growth of non-supervisory employees accelerated to a level coincident with the last expansion
 |
| Public (blue rhs) and Private employment as % of labor force |
In economic parlance, we can translate the first one as a change from a marginal pressure right on labor supply curve (curve inching slowly right as labor force grows) to curve shifting slowly left. Ceteris paribus, and assuming a downward slopped demand curve, the consequences would be an increase in the price of labor (coincident with #3) and a slight reduction in quantity demanded at the new price. The second would represent the public sector going from a marginal impulse left on the labor demand curve, to neutral or right maybe a slight force right, which will lead to stable or increasing price of labor (coincident with #3) and an increasing quantity of labor demanded at the new price. The third observation, present since Q1 of 2013, tells us that despite the public sector drag in the first half of 2013, private sector employment growth (demand curve shifting right) has been enough to lift average wages and increase the number of units of labor demanded at the higher price.
With the private sector labor demand growing, public sector stable, or growing, and labor supply (labor force) stable or shrinking, the only plausible answer is wage growth. And, as the marginal unit of labor required to produce a marginal unit of final output goes up in price, so must marginal profit margins fall. But this is not the most interesting part.
 |
Capital expenditures / GDP (blue, lhs)
After-tax profits / GDP (red, rhs) |
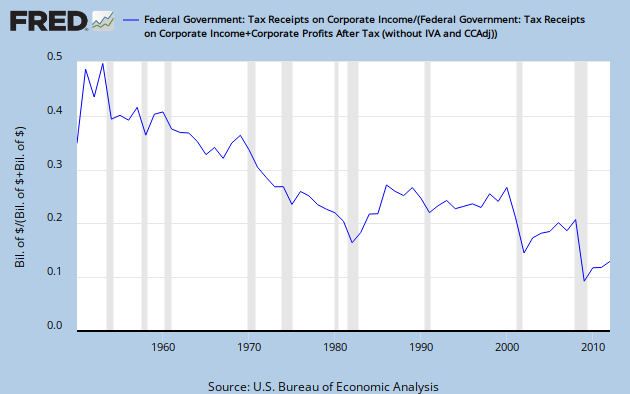
The interesting part about the position we find ourselves in is that, because of the very low effective
corporate income tax rate (~16.35% last year), and very low corporate investment rate, the marginal dollar earned by the corporate sector has very little impact on the economy, it just sits as retained earnings. Using
Manufacturers' New Orders: Nondefense Capital Goods as a proxy for capital expenditure we can see that even though
corporate profits as a share of GDP have increased, capital expenditures as a share of GDP have decreased, meaning the
marginal propensity to invest in new capacity is low. This is because of depressed aggregate demand caused by the low labor share of income and previously mentioned low real wages.
This, finally, gets me to my much delayed points:
- If the marginal effective tax rate of the household sector is higher than that of the corporate sector, which we know is true because FICA on its own is 15.3% (split by employer and employee), a marginal dollar that moves from profits to wages will increase tax receipts
- If the marginal propensity to consume of households is larger than the marginal propensity to invest of corporates, a marginal dollar that moves from profits to wages will increase aggregate demand
- If the marginal propensity to consume or invest of the public sector is greater than the marginal propensity to invest of the corporate sector, the increase from #1 will increase aggregate demand
- Any savings by households and/or government in excess of investment will be coincident with lower profits, all else equal.*
- Any increase in demand for labor by the public sector in response to #1 (in the form of bigger budgets) will be a marginal pressure to the right in labor demand which, all else equal, will lead to an increase in both the price and quantity demanded at the new price of labor.
- Increases in employment and household income will reduce the cyclical deficit and reliance on government assistance programs like medicaid and "food stamps." This is, once again, an increase in government savings which is negative for profits.
I will stop here, as you are likely seeing the self-reinforcing cycle that will be triggered. Because
payroll and individual income taxes make up the lions share (~ 80%) of federal tax revenue, this will lead to a very strong self-feedback loop that will ultimately pressure corporate profit margins down and real wages up, reducing both the income and wealth distribution skew (the proverbial labor/capital divide) while redistributing corporate savings to the household and public sector.
 |
10y treasury yield minus %YoY change in CPI (blue)
%YoY change in average non-supervisory hourly wage
minus %YoY change in CPI (red) |
If the
past is any indication, a real increase in wages will lead to higher nominal and real rates of interest for long term securities (thanks to
Matt Busigin for this one) which, if you recall earlier discussion, is one of the primary reasons for the elevated levels of profit margins. As liabilities mature and reprice at higher rates, this will be a direct hit to profit margins, especially so if the increase in the rate of financing is not only nominal but also real. Given the
very low present financing rates (without even mentioning qualitative measures like easy covenants) any future liability repricing is likely to increase the cost of capital and, once again, pressure profit margins.

Grantham, Hussman, Gross and many other investment managers have expressed concerns over elevated profit margins. To my knowledge, none of them have chosen to describe exactly how and why profit margins will fall and who will benefit and how. In this analysis, it is obvious that the beneficiaries of the sectoral rebalancing will be
wage-earning households and tax receipts. The losers will be the
labor-intensive employers, especially those that are highly leveraged because the cost of debt capital and cost of labor will rise at a speed greater than final demand or price inflation. It should also be clear by now the role of low investment (capital formation) and high unemployment (and associated cyclical deficits and low household savings rates) have had in the final sharp impulse upwards of corporate profits during a struggling economy and that, as labor markets recover, the household and government savings rate will gradually recover as corporate savings decline. Perhaps ironically, the same lack of investment that has helped prop-up corporate savings and holding unemployment high and kept inflation low will, as real wages increase, be the cause of any future increase in inflation. As,
Matt Busigin has shown before and you can see to the right, this analysis is not only
theoretically sound, but also empirically true.
 |
| Net Investment / GDP |
This is likely to be very, very long cycle, even if it hits small cyclical snags along the way. Wages just started growing, the public sector just stopped being a drag on employment and
net investment just turned positive. To anyone who missed the historic stock market rally, it may feel like it is too late, but this is just the beginning of the
real economic recovery. It is also the beginning of inflationary pressures, but it will benefit wages more than prices. If you are wondering, "
what's the play?" it is to favor being exposed to credit risk backed by public sector and household incomes and avoid being exposed to credit risk being backed by corporate incomes, especially those that are labor-intensive or highly indebted. Because the Federal government is considered a credit-risk free entity, this would mean the credit risk of state and local governments (which are ultimately backed by incomes of the residents) and of households, either directly through securitized obligations or indirectly through institutions that have a large exposure to households as creditors. Using extreme examples, you would want to own a company that insures mortgages and consumer ABS securitizations as well as municipal bonds, and avoid the lower tranches of any recent vintage CLO.
Is this a doomsday sign for stocks? Maybe not. It is possible that aggregate demand growth is enough to let profits fall as GDP increases and profits rise more slowly, however, it is not likely in my opinion. Assuming a reversal to mid 2000s effective corporate tax rates of 22% after tax profits as % of GNP to a generous 7% (median is 6.10% and mean is 6.34%) and a NGNP growth rate of 6% (mean 6.11%, median 6.7%, current 3%) over 10 years the CAGR of after-tax corporate profits would not amount to more than 1.65%. But it is also not terrible. GMO likes to flaunt their 1100 "fair value" number and Hussman is partial to his price-to-sales ratio chart, but there is no reason for stocks to fall to their fair value, and every day that passes, their fair value will close in to their present value, and at an accelerating pace. This would make selling short equity a trade with a short lifespan, while other trades--especially those where time works in your favor, like
being long high-grade municipal bonds, an asset class which happens to be
offering remarkable value--offer much more attractive ways to play the thesis.
Shorter version
Marginal head-winds for employment and wages are turning into marginal tail winds as the economy recovers. These same factors posses self-reinforcing properties and are likely to continue to be positive impulses for, real wages, employment levels, tax receipts, and aggregate demand and negative impulses for corporate profit margins and corporate savings. Favor the liabilities of the household and public sector over those of the corporate sector.
*Going back to Kalecki's Profit equation we can remember that:
Corporate Saving = Profits - Dividends
Profits = Investment – Household Savings – Government Savings – Foreign Savings + Dividends