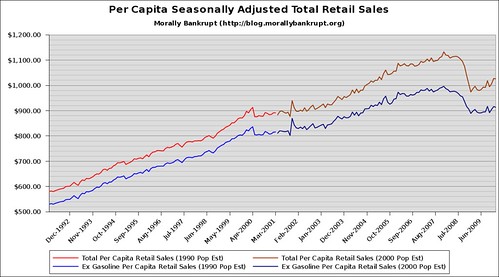
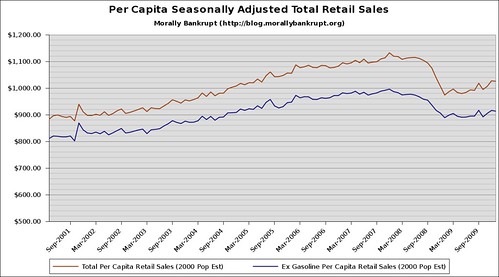
Earlier today Calculated Risk posted about an improvement in total retail sales. I was interested in how these numbers would look once adjusted to their per-capita numbers. Obviously the population estimates (from the Census Bureau) might have a little bit of an error margin, but I wanted to see how the spending trends of Americans had, or had not, changed. In essence, I wanted to know if people were really spending more, or if the growth in total sales was just a by-product of population growth.
This doesn't say much about the retail sector, because it isn't adjusted to account for store openings and closings, in other words, as stores close and sales keep steady, revenue per store is increasing, but it does give us some clues as to whether there is upcoming expansion in the retail sector as the recovery takes hold. From what I gather from these graphs, I'd say an expansion in the number retail outlets is not something we should be expecting any time soon, which is bad news for REITs that operate shopping centers.
There is no adjustments for price levels, because of auto-correlation. Please feel free to submit questions, comments, or sector-specific requests.
I look forward to, in the future, making all my data sources available so they can be reviewed by anyone who may have any doubts about my methods. Just hold on a bit for that.