This post is part of the series Housing Affordability 1971-2009
In the previous post, I discussed how borrowing capacity changes with respect to interest rates, finishing up with an example of the buying power of a $500 monthly mortgage payment from 1971-2009. The example is obviously a gross oversimplification; income and price levels can and have changed since then. To try to make some sense of this all, I decided to look at the data from two sides:
- The change over time in the cost of a median-price new home and the monthly mortgage payment necessary to buy it, a function of the price level and interest rate.
- The change over time in the median-household income and the borrowing capacity based on it, a function of the income level and interest rate.
Why a median-income household?
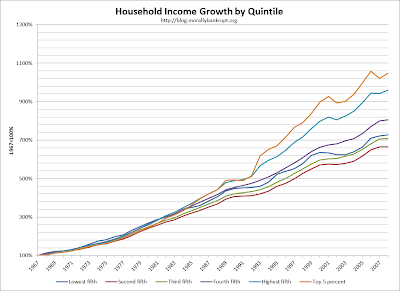
While I could have used mean earnings, I decided to use median earnings because, not only is there a positive is a skew in earnings as a result of the super-wealthy affecting the mean, but the growth in income of the top quintile--and especially the top 5%--of earners has massively outpaced the growth in income of the second, third and fourth quintiles, as you can see below.
Why 30%?
The number is largely arbitrary, but it seems to be a rule-of-thumb that I've learned from friends in real-estate, people in underwriting and commentators on the sector. They all seem to agree that housing expenses should not exceed one-third of income. A quick-and-dirty comparison of median-price new home mortgage payments and median incomes gives us a mean of 34%, which is close enough for me to feel comfortable with the 30% figure. There is obviously a wild spike in the early 80s, and the comparison isn't perfect, but I don't think I am materially misrepresenting anything. I have seen friends and coworkers calculate how much they want to pay for a home by calculating how big of a loan they can afford at their current income levels. If enough people have this same mindset, prices that move in concert with borrowing capacity make perfect sense.
Why median-price new home? Why not use existing home sales?
I think that new homes reflect this relationship better, as older homes may depreciate as they are worn down, or need work, or change price as areas become more or less desirable places to live. New homes generally reflect the current standard of living and amenities and are constructed in areas that are expected to be desirable places to live. While national numbers might now accurately represent the high-density urban areas, it is my opinion that new home prices are sufficiently representative of housing prices. Because I picked median-income, I decided to use median-price new homes as well.
Potential Problems
- The assumption that median-income households buy median-price homes. This is a problem because the lower-income households are more likely to rent and less likely to own, meaning that the people buying median-price new homes are probably a little higher on the earning scale than median-income. I welcome any potential solutions.
- Freddie Mac rates only go back to 1971, I would like to find the equivalent rate prior to that.
- Census data may undercount the poorest, most rural, or certain minorities.
- There's no easy way to adjust for additional expenses that are large components of housing, like fees in condos and gated communities, the cost of mortgage, hurricane, disaster insurance, and household's other burden's
- There is no hedonic adjustment for increasing quality / size / amenities. This is deliberate, we are not measuring constant standard of living, we want to capture the affordability of a standard of living that's moving with the norm.


Are you planning to purchase your next home, 1st home, that dream realized home, a vacation home, investment property or refinance your overall loan, Home Loans California you will see it when you get your home loan.
ReplyDelete